February 1, 2020
Jim McCaul — Activity in the deepwater sector took a huge hit in the second half of last decade as a result of a global oil demand/supply imbalance, downturn in oil prices, hiatus in Petrobras production floater orders and large industry cutbacks in upstream spending. The downturn was the worse to ever hit the offshore sector. Orders for new equipment dried up, backlog fell and many suppliers were forced to cut personnel — some were forced out of business. But the downturn has bottomed — and as discussed below orders for production floaters are on the uptick, a large portfolio of new projects are in the planning stage and underlying market conditions are favorable to deepwater investment decisions.
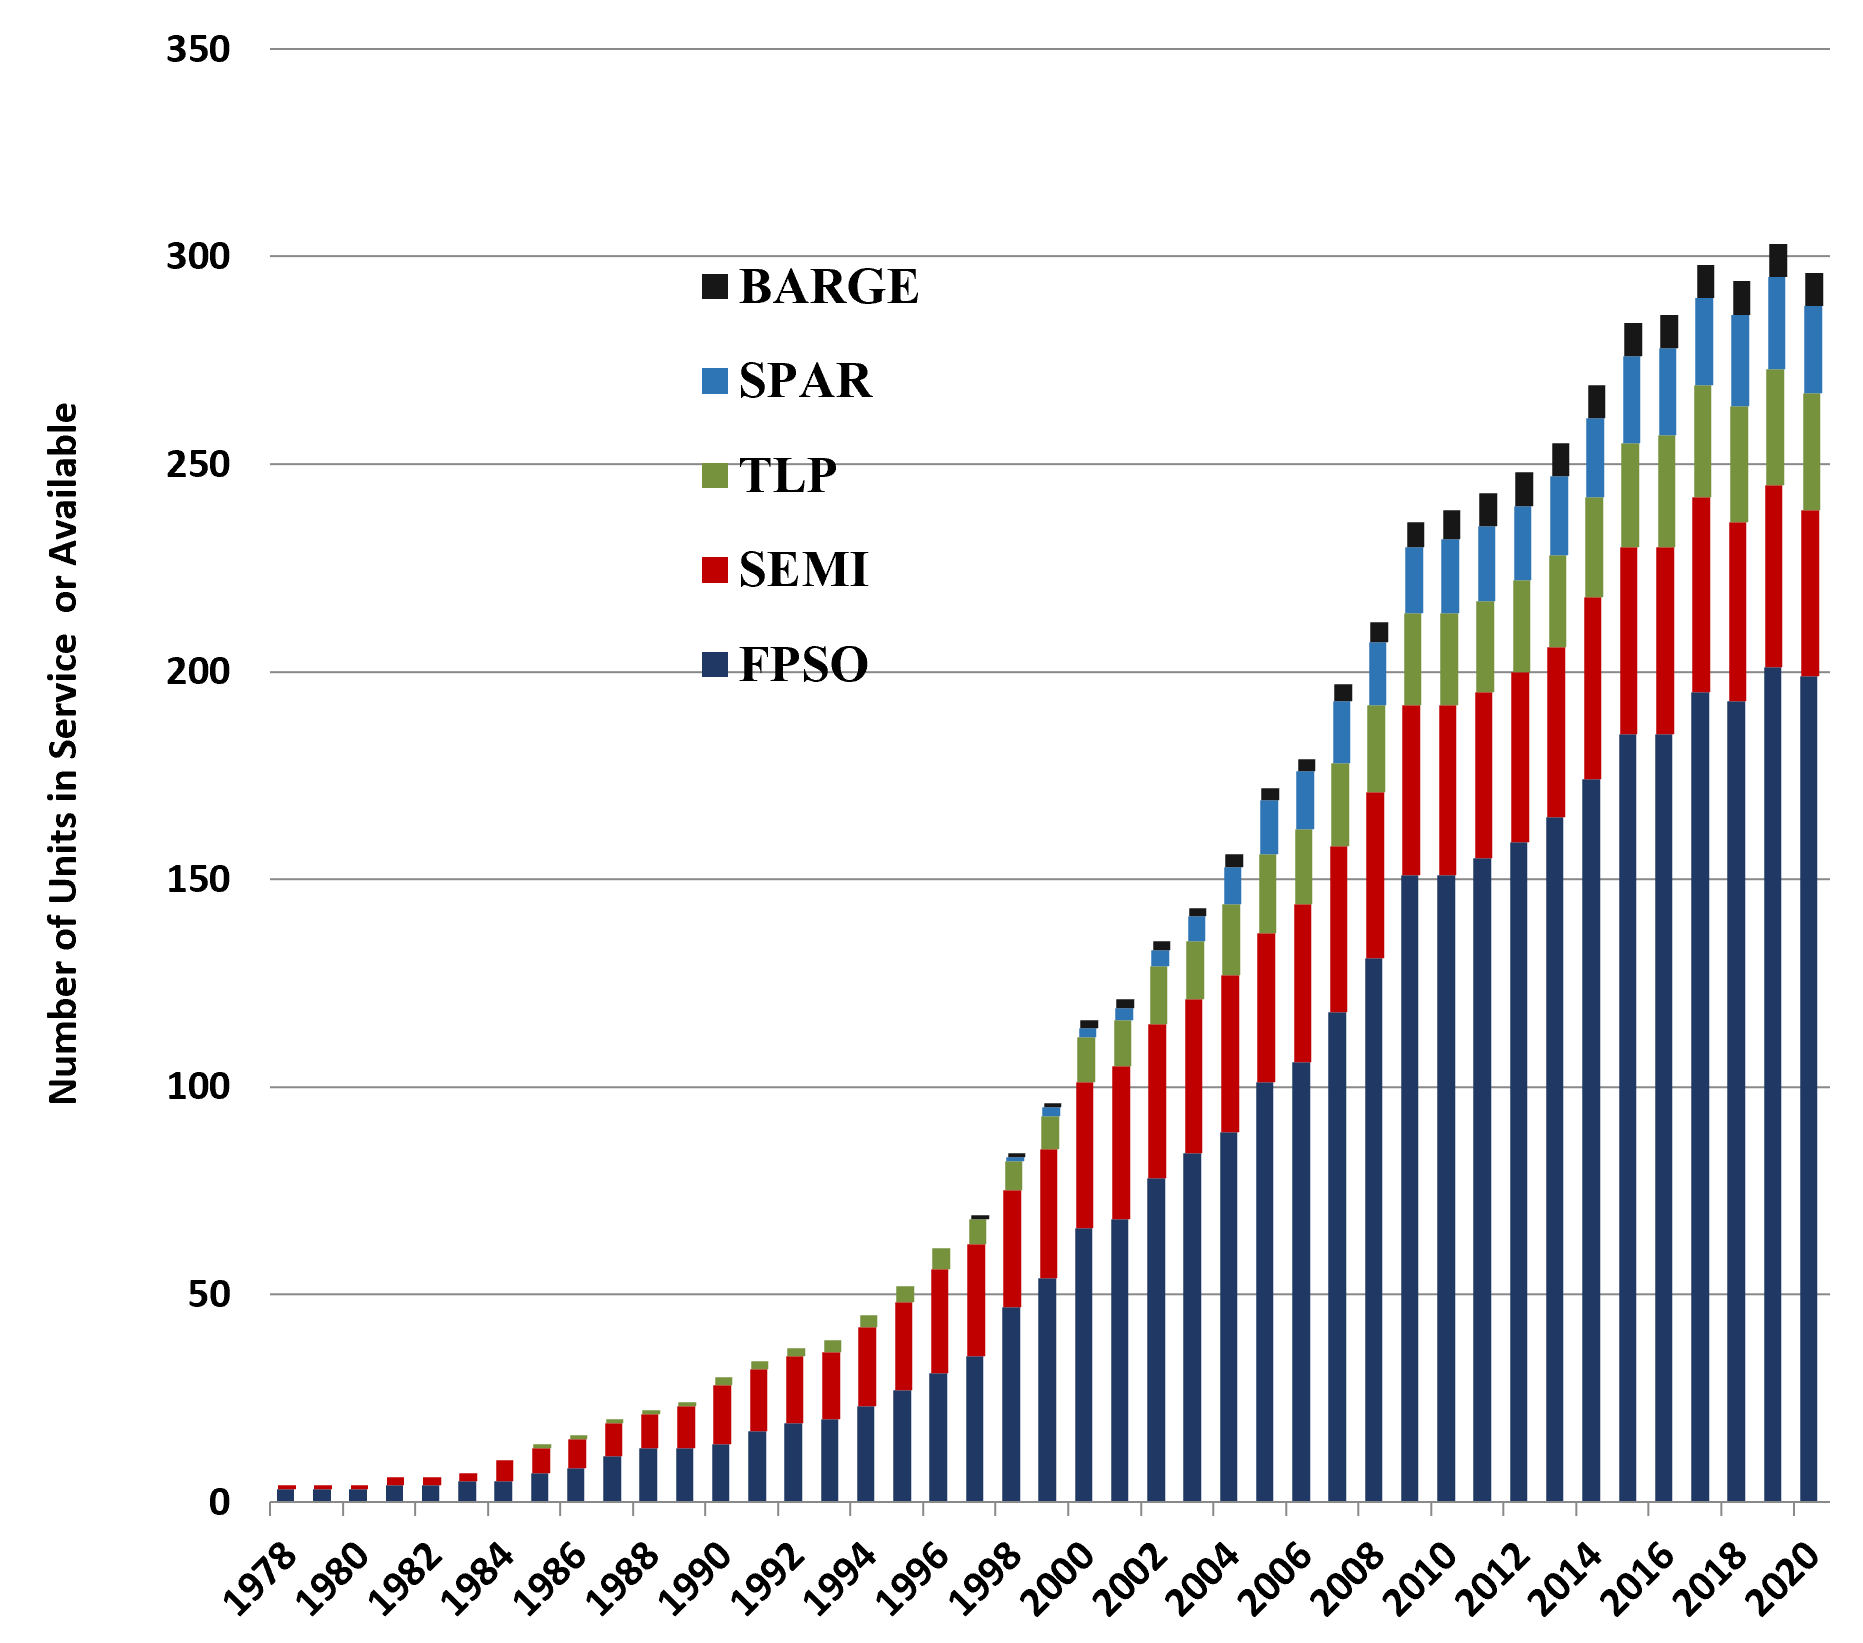
The number of floating production systems in operation has steadily increased since startup of the first production floater in the mid-1970s. Ten years were needed to reach 15 units in operation. By end of the second decade over 50 units were in operation. At end of the third decade the number had grown to around 170 units in service. Now there are just under 300 production floaters in service or available — and another 29 on order. (Exhibit 1)
(As of January 2020)
Type Floater | Total | Installed | On Order | Available |
FPSO | 221 | 178 | 22 | 21 |
Barge | 9 | 8 | 1 | 0 |
Semi | 46 | 37 | 6 | 3 |
Spar | 21 | 21 | 0 | 0 |
TLP | 28 | 28 | 0 | 0 |
All Units | 325 | 272 | 29 | 24 |
Source: IMA/World Energy Reports Database
But growth in production units has not escaped the long term S-curve growth pattern typical of all industries. Growth in number of production floaters has been slowing as field decommissionings offset new project starts. Over the five year period
(Installed and available units as of beginning January each year; excludes FLNGs and FSRUs)
Source: IMA/World Energy Reports Database
Contracts for 123 production floaters have been placed over the past ten years — an average of around 12 units annually. FPSOs accounted for 97 of the contracts. FPUs accounted for 26 contracts. Included in the FPU contracts were 12 production semis, 6 TLPs, 5 spars and 3 barges. (Exhibit 3)
A high of 27 contracts was reached in 2010 when Petrobras ordered the hulls for eight serial FPSOs (two were subsequently cancelled, one later rebid). The low was in 2016 when no orders were placed.
Orders returned in 2017 as the oil market recovered and over the past three years 32 production floaters have been ordered — 25 FPSOs and 7 FPUs.
FPSO orders since 2017 include 9 large units for use by Petrobras in Brazil (7) and by ExxonMobil in Guyana (2). Not counted in the FPSO total are two speculative FPSO hulls ordered by SBM in December 2019 — they will be included when a field contract is executed. In 2020 there has been one FPSO order as of
The 7 FPU contracts since 2017 include 6 production semis and a small production barge. No production spars or TLPs have been ordered over the past five years. The latest spar order was in 2012. The last TLP order was in 2013.
Ordered over the Past Ten Years
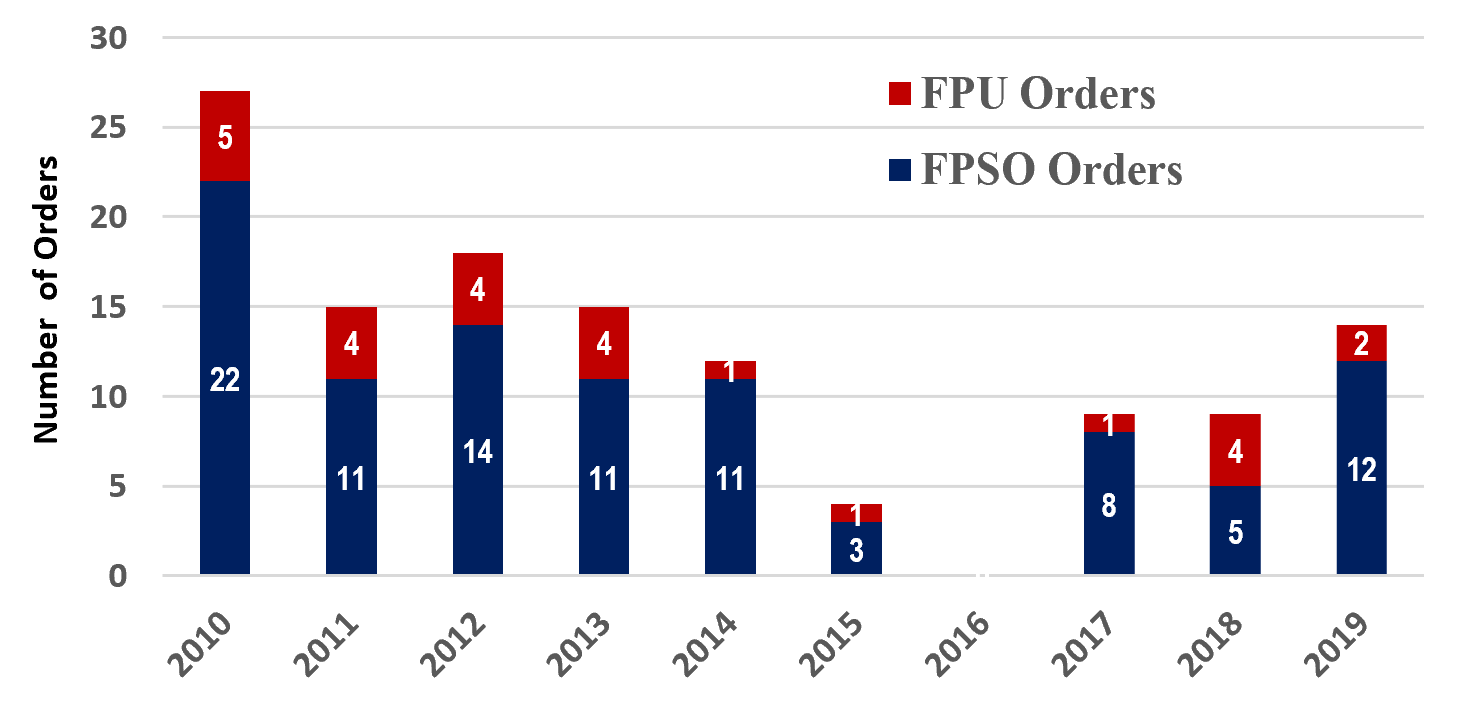
Source: IMA/World Energy Reports Database
Included among the 29 production floaters now being built are 22 FPSOs, 6 production semis and a production barge. A third of these units are well into the construction program, with production start planned in 2020/21. Two thirds are more recent contracts where construction is at an earlier stage and production start is planned in 2022/24.
Seven (32%) of the 22 FPSOs being built are for use offshore Brazil. The rest are for use offshore West Africa (3), Guyana (2), Northern Europe (2), India (2) — and Mexico, Israel, China and Australia (1 unit each). The remaining two FPSOs are speculative hulls that at the moment have no field assignment — but are likely to be used on future contracts in Guyana or Brazil.
Thirteen of the FPSOs are being built on new hulls. Nine are conversions or upgrades to existing units. China is clearly the major location for FPSO construction and conversions. Eighteen of the 22 FPSOs on order are partially or fully contracted to Chinese yards. Singapore has retained second position, with 3 orders. One FPSO contract has been placed in Korea. Topsides plant fabrication and integration is spread over a variety of contractors in Asia, Europe and Brazil.
Five of the 6 production semis now being built are destined for use in the Gulf of Mexico. The remaining unit is for use offshore China. Construction of these semis is divided among builders in Korea, China and Singapore — each location having 2 production semi contracts. Some topside fabrication and integration is being performed in the US.
Production Floater Projects in the Planning Stage
We have been tracking 130 projects in the planning stage that are likely to require a production floater for development. They include 118 projects where an FPSO is the likely production solution, 12 where a production semi is likely to be required.
Brazil is the dominant location for future production floater requirements — with 38 projects in the planning queue, Other major locations with floater projects in the planning stage are Africa (30 projects), SEA (16 projects), Northern Europe (12 projects) and the Mexico/US GOM (10 projects).
Some of the projects are near term, some further out. Of the total, 8 projects are at the bidding or contract negotiation stage. Another 10 are in the near term investment queue and 8 are in FEED. Another 79 projects are further out in the planning stage — either in development concept definition (45), exploration and appraisal (25), priority prospect (7) or commercial framework negotiation (2).
The remaining 25 projects in the planning queue are stalled. Some are stalled due to economics. Some are awaiting field partner or agreement on field commercial terms. Others are stalled by government opposition, field rights issues, operator failure or sanctions that prevent the project moving forward. (Exhibit 4)
Projects in the Planning Queue of January 2020
(Excludes FLNG, FSRU and FSO Projects)
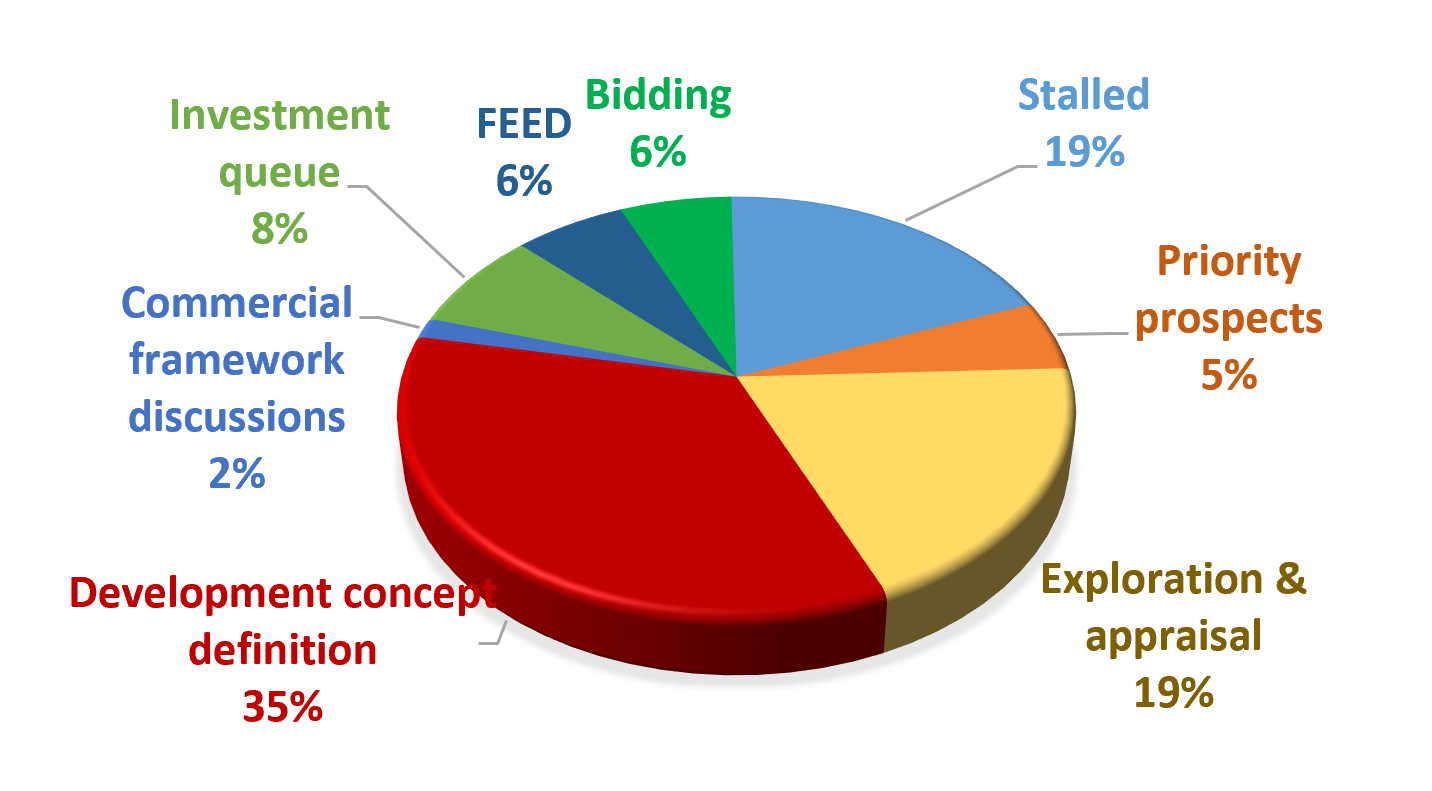
Source: IMA/World Energy Reports Database
While 130 FPSO/FPU projects are at various stages of development planning, underlying market conditions will influence if and when individual projects move forward to the investment commitment and placement of a floater construction contract.
IMA/WER each year looks in detail at conditions likely to exist in the deepwater market over the following five years. Here’s how we see the market situation between 2020 and 2024.
In the (mostly) positive category are
In the (mostly) negative category are
In the unknown category are
Based on our analysis of future market conditions, we are forecasting orders for 41 to 56 FPSOs and 8 to 12 FPUs between 2020 and 2024. The construction contracts are expected to generate expenditures of $56 to $77 billion.
Brazil is expected to account for 30 to 40% of the FPSO orders over the next five years. Africa is expected to be the second largest source of FPSO activity, with around 25% of the orders. Next in line are Northern Europe and SE Asia/China, each with around 10%.
We expect that 20 to 25% of FSPO projects over the next five years will involve use of a redeployed FPSO. Assuming the most likely forecast scenario, we expect 10 to 13 FPSO projects will entail redeployments.
FPU orders over the next five years will be principally if not wholly comprised of production semis. Most will be for projects in the US GOM or offshore Australia.
No TLP and few spar projects are currently visible.
Details for our 2020 production floater forecast are provided in the IMA/WER market outlook report issued in late 2019. We examine timing of EPC contracts, sources of buying power, floater procurement strategy, use of redeployed FPSOs, competitive landscape, etc. In our monthly reports we track how actual order intake correlates with the forecast and in March of each year we recalibrate the forecast to reflect changes in market situation.
For information about our 2020 Floating Production Report and Database, please visit our website at www.worldenergyreports.com — or contact Paul Morris at pmorris@worldenergyreports.com or call Paul at 1 212 477 6944.
By Jim McCaul — IMA/World Energy Reports